

A recent study highlights which automobile brands have excelled in safety ratings throughout the U.S. during the last ten years. This analysis sheds light on manufacturers prioritizing safety, as evidenced by New Car Assessment Program (NCAP) test scores. While the findings are impressive on paper, they raise questions about how much real-world safety these tests represent.
Every new model from Volvo, Subaru, Tesla, Genesis, and Polestar has achieved a perfect 5-star rating over the past decade. But do these scores guarantee superior performance in unpredictable real-life scenarios? NCAP’s controlled conditions often differ considerably from what one might encounter on highways or during adverse weather.
The study, conducted by Confused.com, delves into crash test performance, rollover resistance, and the effectiveness of advanced driver assistance systems (ADAS). These factors collectively determine NCAP ratings, which automakers often use as a testament to their safety credentials.
Volvo remains a leader in safety over the years. Every model it released in the past decade achieved a 5-star NCAP rating.
Top Performers: Volvo, Subaru, and Others
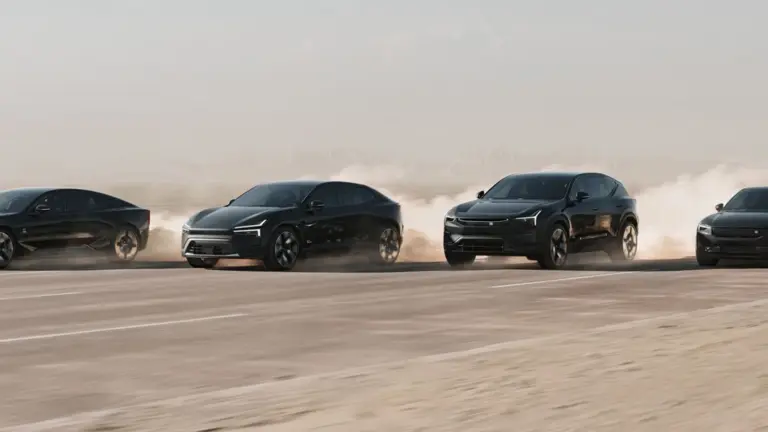
Volvo leads the rankings, with 76 of its models receiving a 5-star rating. Subaru follows closely with 72 models, while Tesla has released 45 models maintaining this perfect score. Meanwhile, luxury brands like Genesis and Polestar, being relatively new to the market, also have stellar records with each model released achieving the top rating.
Brands like Buick and Acura also garnered significant praise. Buick scored 98.31% of its tested cars with 5-star safety ratings, while Acura followed at 98.18%. Other big names like Honda, Mazda, and BMW consistently achieved scores above 90%.
Yet some brands underperformed. Mini, Fiat, Smart, and Suzuki did not produce a single car with a 5-star rating during the past ten years.
Safety Ratings: More Than Just Numbers
While NCAP scores signify safety under specific circumstances, other factors matter. A car may perform well in controlled crash tests but still lack durability or reliability in long-term real-world usage. Moreover, the number of vehicles tested per manufacturer varies greatly. For example, testing three Polestar models isn’t the same as evaluating over 100 models released by Honda or Volkswagen.
Additionally, safety ratings often don’t consider unique challenges, like poor lighting on back roads or multi-vehicle accidents on busy highways. Hence, consumers should view these ratings as just one piece of the larger puzzle when choosing their next car.
Customer Complaints Reveal Another Layer of Insight
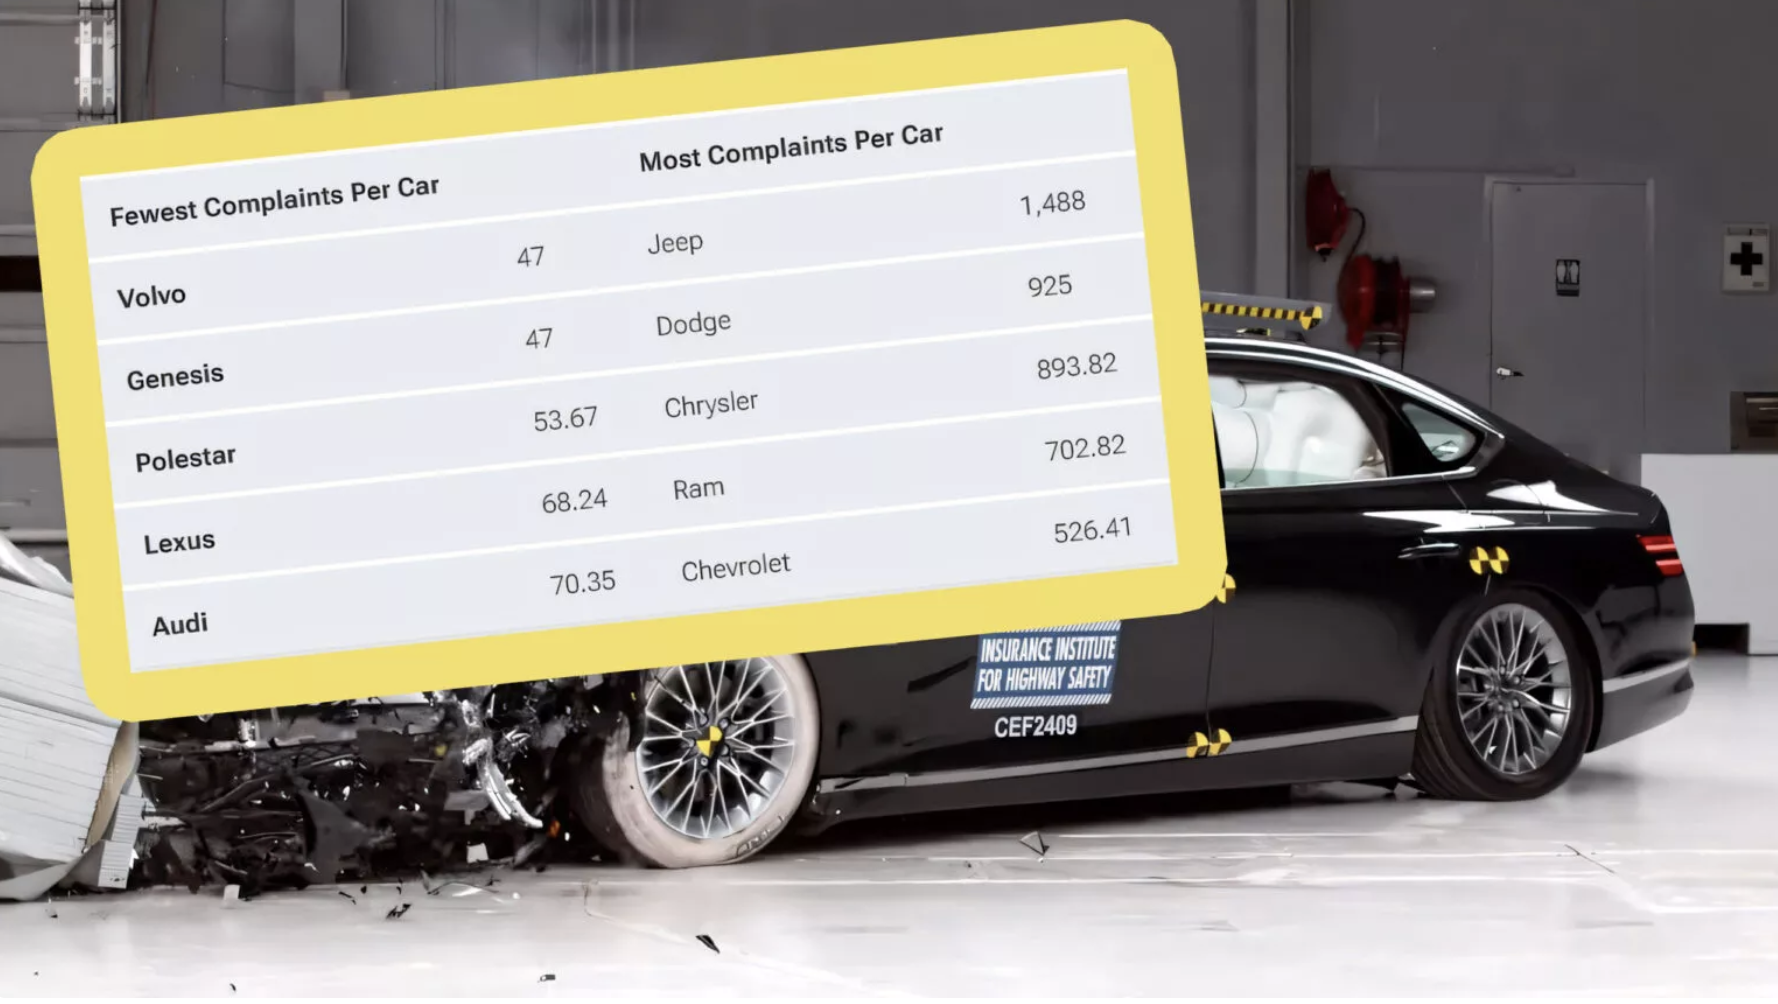
Beyond safety ratings, data from the National Highway Traffic Safety Administration (NHTSA) showcases how vehicles perform over time. Volvo and Genesis dominate here as well, recording the fewest complaints per car, with an average of 47 complaints. Polestar, Lexus, Audi, and Mitsubishi also ranked well.
On the flip side, brands like Jeep, Dodge, and Chrysler earned notoriety for generating the most complaints, with Jeep leading at an overwhelming 1,488 complaints per car.
Tesla presents an interesting case. While all of its released cars secured perfect 5-star safety scores, it still averaged 391 complaints per car. Most of these complaints hint at build quality issues and concerns over ADAS systems.
Reshaping Automotive Trends Post-2024
An intriguing pattern emerges when looking at cars manufactured after 2024. These models boast the highest proportion of 5-star safety ratings in history. However, earlier setbacks, such as supply chain disruptions in 2022, led to lower-quality materials being used in models from some manufacturers, temporarily lowering overall industry scores.
As technology advances further, it’s expected that automakers will incorporate even more sophisticated safety measures. Next-generation ADAS systems and AI-powered accident prevention techniques are already under development, paving the way for a safer driving experience across all brands.
Key Metrics From the Study:
Brands with the Most 5-Star Safety Ratings:
MAKE |
Cars Tested |
w/ 5 Stars |
Percent 5-Star Safety Scores |
VOLVO |
76 |
76 |
100.00% |
SUBARU |
72 |
72 |
100.00% |
TESLA |
45 |
45 |
100.00% |
GENESIS |
15 |
15 |
100.00% |
POLESTAR |
3 |
3 |
100.00% |
BUICK |
59 |
58 |
98.31% |
ACURA |
55 |
54 |
98.18% |
HONDA |
111 |
105 |
94.59% |
MAZDA |
55 |
51 |
92.73% |
BMW |
92 |
84 |
91.30% |
AUDI |
113 |
102 |
90.27% |
VW |
87 |
76 |
87.36% |
LINCOLN |
58 |
50 |
86.21% |
LEXUS |
105 |
90 |
85.71% |
INFINITI |
32 |
27 |
84.38% |
MERCEDES |
34 |
28 |
82.35% |
TOYOTA |
194 |
148 |
76.29% |
HYUNDAI |
101 |
72 |
71.29% |
CADILLAC |
61 |
42 |
68.85% |
KIA |
96 |
66 |
68.75% |
CHRYSLER |
34 |
22 |
64.71% |
CHEVROLET |
169 |
109 |
64.50% |
FORD |
256 |
152 |
59.38% |
DODGE |
51 |
26 |
50.98% |
NISSAN |
121 |
61 |
50.41% |
MITSUBISHI |
45 |
16 |
35.56% |
GMC |
83 |
29 |
34.94% |
JEEP |
41 |
6 |
14.63% |
RAM |
33 |
4 |
12.12% |
MINI |
14 |
0 |
0.00% |
FIAT |
4 |
0 |
0.00% |
SMART |
4 |
0 |
0.00% |
SUZUKI |
1 |
0 |
0.00% |
Brands with the Fewest Complaints Per Car:
| Brand | Complaints Per Car |
|---|---|
| Volvo | 47 |
| Genesis | 47 |
| Polestar | 53.67 |
| Lexus | 68.24 |
| Audi | 70.35 |
Brands With The Fewest NHTSA Complaints
MAKE |
Total Cars Included Since 2024 |
Count of Complaints 2015-2019 |
Count 2020-2024 |
Total Complaints |
Complaints per Car Tested |
VOLVO |
76 |
1717 |
1870 |
3587 |
47.20 |
GENESIS |
15 |
63 |
645 |
708 |
47.20 |
POLESTAR |
3 |
0 |
161 |
161 |
53.67 |
LEXUS |
105 |
4871 |
2294 |
7165 |
68.24 |
AUDI |
113 |
3791 |
4159 |
7950 |
70.35 |
MITSUBISHI |
45 |
2282 |
1430 |
3712 |
82.49 |
SMART |
4 |
248 |
95 |
343 |
85.75 |
LINCOLN |
58 |
3556 |
2699 |
6255 |
107.84 |
CADILLAC |
61 |
4861 |
3488 |
8349 |
136.87 |
ACURA |
55 |
3940 |
4098 |
8038 |
146.15 |
INFINITI |
32 |
2775 |
1919 |
4694 |
146.69 |
BUICK |
59 |
5451 |
3240 |
8691 |
147.31 |
MINI |
14 |
1526 |
895 |
2421 |
172.93 |
MAZDA |
55 |
7177 |
4345 |
11522 |
209.49 |
BMW |
92 |
12434 |
7992 |
20426 |
222.02 |
VW |
87 |
12395 |
10096 |
22491 |
258.52 |
MERCEDES |
34 |
3190 |
6015 |
9205 |
270.74 |
TOYOTA |
194 |
35242 |
21385 |
56627 |
291.89 |
GMC |
83 |
13283 |
10982 |
24265 |
292.35 |
SUBARU |
72 |
8651 |
13949 |
22600 |
313.89 |
KIA |
96 |
12910 |
22917 |
35827 |
373.20 |
NISSAN |
121 |
27461 |
17989 |
45450 |
375.62 |
TESLA |
45 |
1562 |
16038 |
17600 |
391.11 |
FIAT |
4 |
1066 |
508 |
1574 |
393.50 |
HYUNDAI |
101 |
19488 |
25999 |
45487 |
450.37 |
HONDA |
111 |
27277 |
30399 |
57676 |
519.60 |
CHEVROLET |
169 |
53287 |
35677 |
88964 |
526.41 |
FORD |
256 |
79361 |
69775 |
149136 |
582.56 |
RAM |
33 |
8010 |
15183 |
23193 |
702.82 |
CHRYSLER |
34 |
21960 |
8430 |
30390 |
893.82 |
DODGE |
51 |
35113 |
12073 |
47186 |
925.22 |
SUZUKI |
1 |
903 |
164 |
1067 |
1067.00 |
JEEP |
41 |
35593 |
25408 |
61001 |
1487.83 |
With a decade of data comprehensively analyzed, patterns become clear. Prioritizing safety isn’t simply about marketing—it’s a dedication to engineering that can literally save lives. Future buyers must weigh the power of perfect safety ratings alongside insights gathered directly from customers who live with these vehicles every day.


Share this Story